The Report
One recording. An 18-page report a practitioner can act on.
Every value sits against a reference band, every layer carries its evidence label, and the final pages translate findings into focus areas and a reassessment interval.
Inside the report
Pages from the sample report.
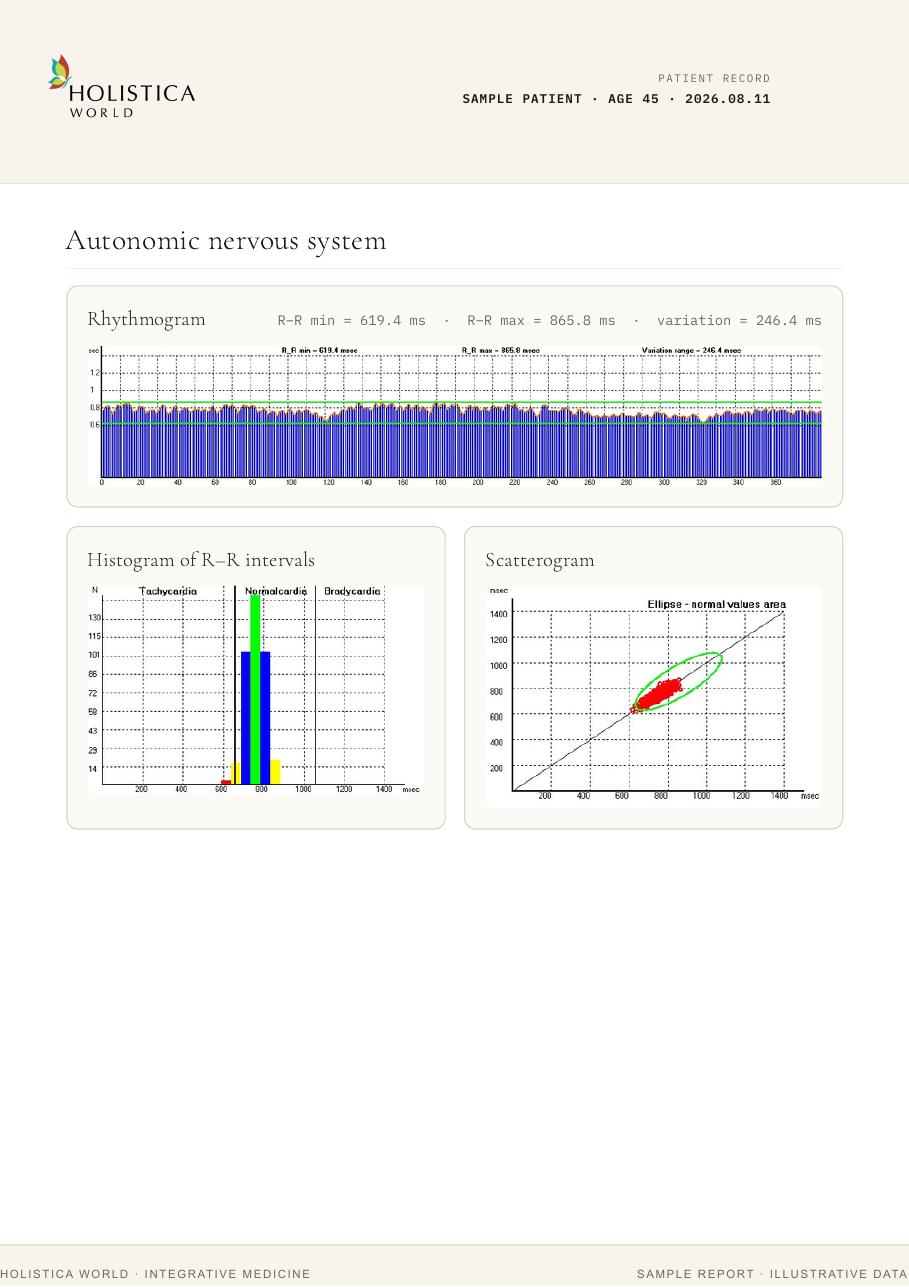
Signal quality
Rhythmogram, histogram and scatterogram make the recording visible before any value is read.
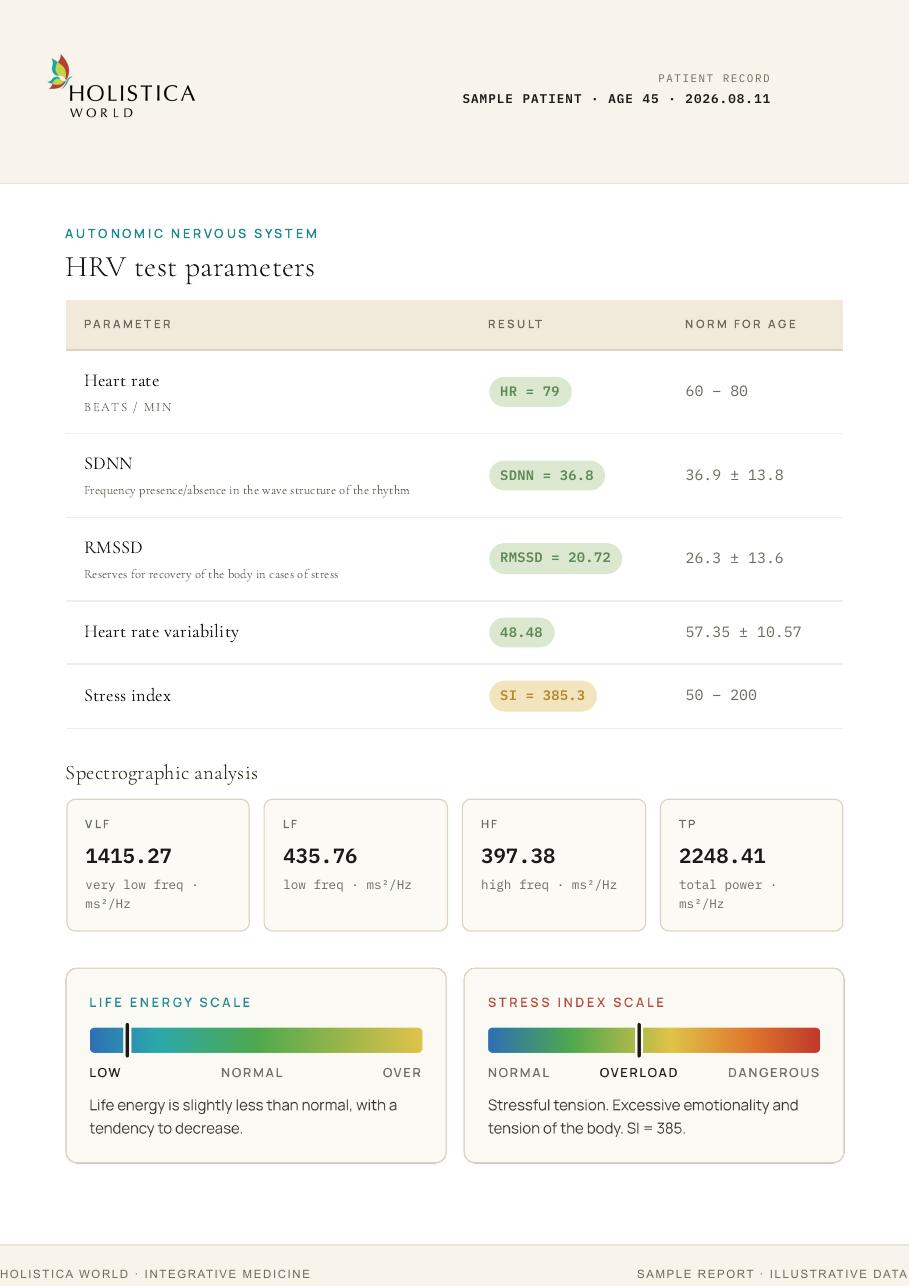
Autonomic profile
Time-domain and frequency-domain indicators sit together in one clinical view.
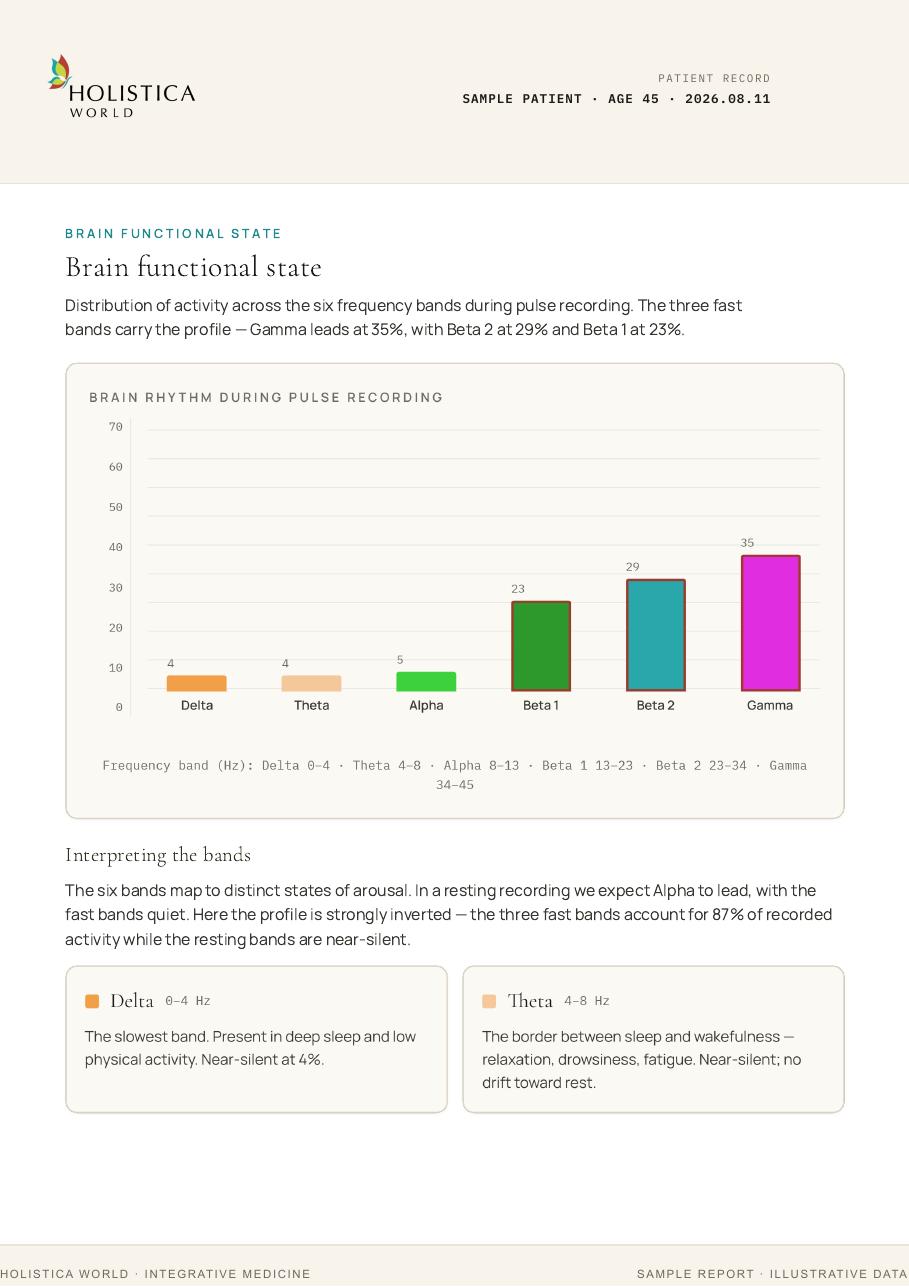
Brain rhythm
Six functional bands displayed against a readable reference frame.
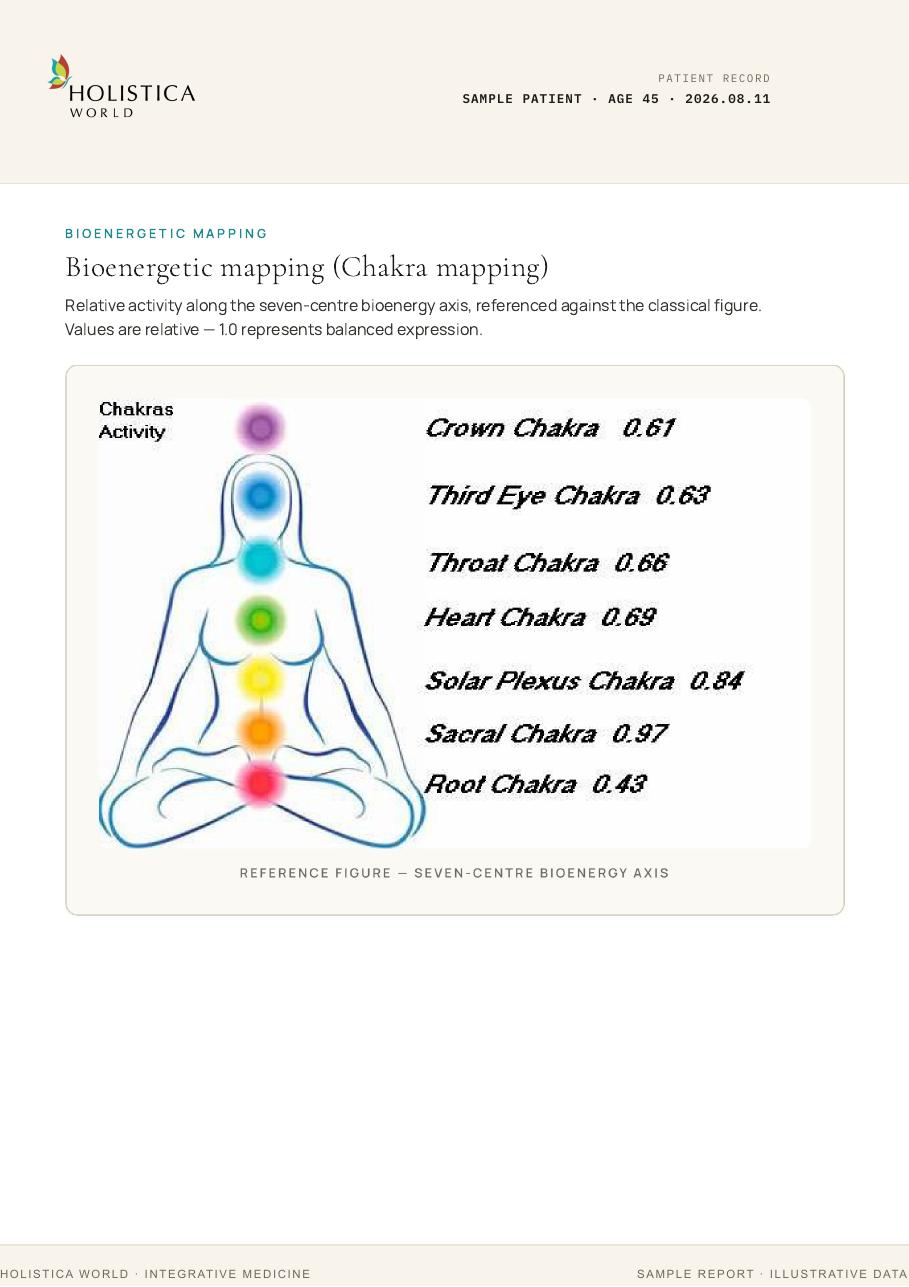
Bioenergy map
A seven-centre visual that supports integrative case discussion.
Report structure
What the practitioner sees, section by section.
| Section | What the practitioner sees | Evidence |
|---|---|---|
| Recording quality | Duration, artefact percentage, beats corrected and quality grade. Reports below grade are flagged for repeat. | Established physiology |
| Autonomic Nervous System | Sympathetic and parasympathetic indices, ANS balance chart, Stress Index, adaptive reserve, resting pulse and respiratory rate | Established physiology |
| HRV Analytics | Time, frequency and nonlinear tables, power spectrum with VLF, LF and HF bands, rhythmogram, histogram and scatterogram | Established physiology |
| Brain Rhythm Analysis | Estimated dominance of Delta, Theta, Alpha, SMR, Beta and Gamma; Focus, Calm and Fatigue indices | Modelled index |
| Cellular Health & Iodine Profile | Perfusion, pulse morphology, vascular ageing index, cellular vitality score and iodine status indicator with confirmatory tests | Modelled index |
| Ayurvedic Mapping | Tridoṣha balance and fifteen sub-doṣha indices | Interpretive framework |
| Bioenergy Report | Seven-centre map and vitality reserve | Interpretive framework |
| Summary & plan | Key findings, focus areas, lifestyle and breathwork pointers, reassessment interval | Practitioner-led |
Sample snapshot
How a summary page reads.
ANS balance
- Sympathetic
- Elevated
- Parasympathetic
- Low-normal
- Stress Index
- 212
HRV
- SDNN
- 34 ms
- RMSSD
- 22 ms
- LF/HF
- 3.4
- Total power
- 1,180 ms²
- DFA α1
- 1.21
Brain rhythm
- Beta dominance
- High
- Alpha
- Low
- Theta/Delta
- Normal
Cellular health
- Perfusion index
- 2.1%
- Vascular ageing
- Age-typical
- Cellular vitality
- 64/100
Iodine profile
- Status
- Possible insufficiency
- Confirm with
- UIC, TSH, fT4
Bioenergy
- Vitality
- Moderate
- Least balanced centre
- Heart
- Reassess in
- 6 weeks
Next step